OnlineFiguresCancerSymptomsNetworks
Online Figures
In this section, you can find the online Figures of the paper titled Bayesian Networks and Causal Inference for the Interpretation of Patients’ Symptom Experience. If you are viewing this from github you can find its html form in the following link.
The following list of interactive Bayesian Networks, ran on the same set of cancer symptom data. The complete dataset consisted of 38 different symptoms collected from 1328 cancer patients. Inside this dataset, there were 295 male and 1033 female cancer patients. There were, also, 958 cancer patients below the age of 65 and 370 cancer patients above the age of 65. Symptom occurrence rates are summarised in online Figures 1 through 5.
The 38 cancer symptoms represented in the graphs below are coded in the following fashion: difcon: Difficulty Concentrating, pain: Pain, energy: Lack of Energy, cough: Cough, nervous: Feeling Nervous, hotflash: Hot Flashes, drymouth: Dry Mouth, nausea: Nausea, drowsy: Feeling Drowsy, numb: Numbness or Tingling in Hands or Feet, chest: Chest Tightness, difbreath: Difficulty Breathing, difsleep: Difficulty Sleeping, bloat: Feeling Bloated, urinate: Problems with Urination, vomit: Vomitting, sob: Shortness of Breath, diarrhea: Diarrhea, sad: Feeling Sad, sweats: Sweats, sexual: Problems with Sexual Interest or Activity, worry: Worrying, itch: Itching, appetite: Lack of Appetite, abdominal: Abdominal Cramps, increaseapp: Increased Appetite, wtgain: Weight Gain, dizzy: Dizziness, swallow: Difficulty Swallowing, irritable: Feeling Irritable, mouthsore: Mouth Sore, wtloss: Weight Loss, hairloss: Hair Loss, constipat: Constipation, swelling: Swelling, taste: Change in the Way Food Tastes, myself: I Do Not Look Like Myself, skin: Changes in Skin.
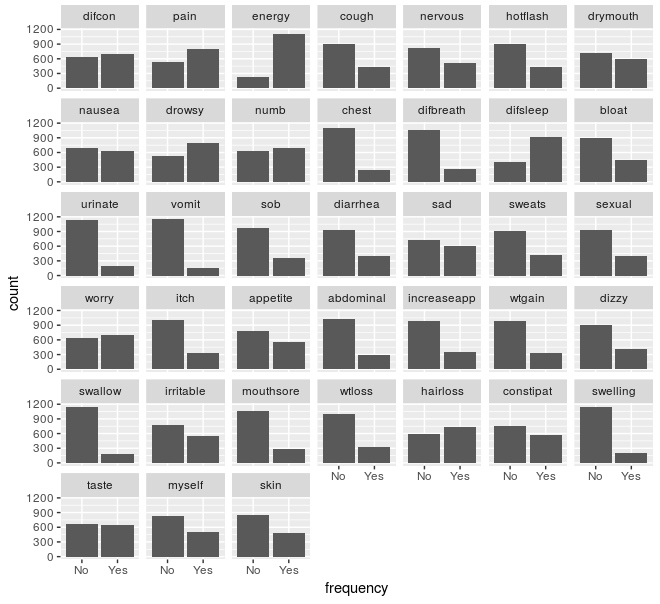
Online Figure 1. Frequency of occurrence of the 38 symptoms for all of the cancer patients (n=1328)
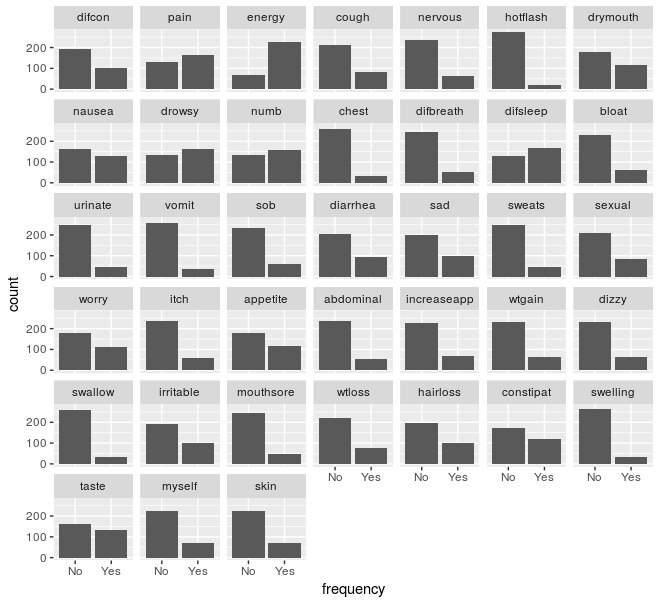
Online Figure 2. Frequency of occurrence of the 38 symptoms for the male cancer patients (n=295)
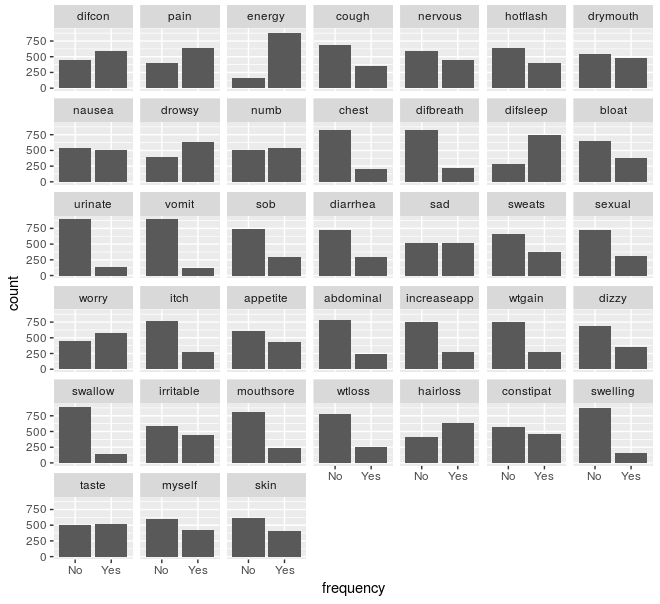
Online Figure 3. Frequency of occurrence of the 38 symptoms for the female cancer patients (n=1033)
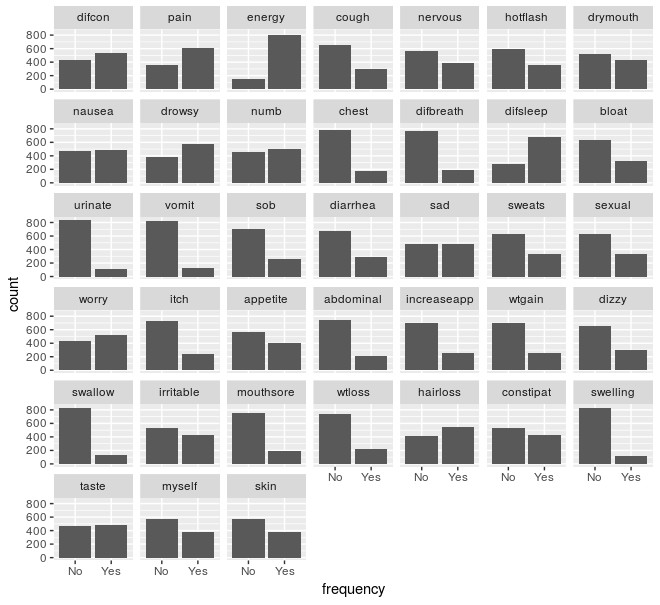
Online Figure 4. Frequency of occurrence of the 38 symptoms for the cancer patients of <65 years of age (n=958)
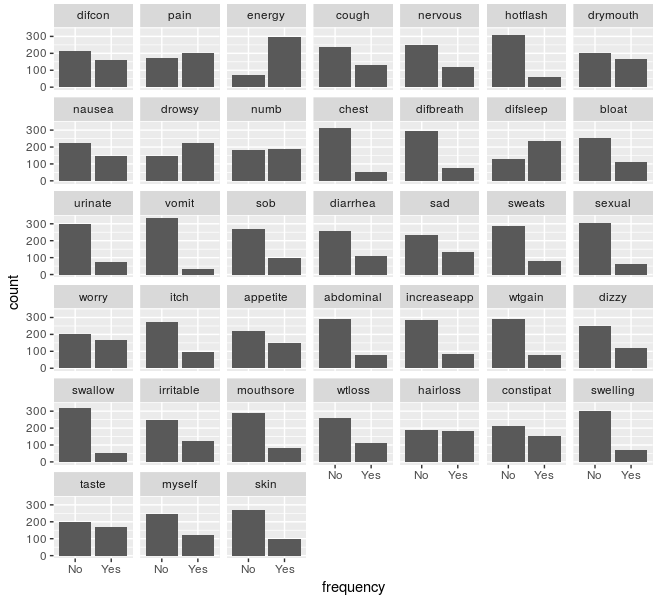
Online Figure 5. Frequency of occurrence of the 38 symptoms for the cancer patients of >65 years of age (n=370)
The networks were created by the symptom dimension of occurrence. The size of nodes represent the prevalence of each symptom in our dataset, among the 1328 cancer patients. The width of the edges are proportional to the strength that symptoms connect with each other, based on the conditional probabilities identified with the BN algorithm.
By clicking on a node you can see its markov blanket, meaning the specific symptom with its parents and children. You can see the same markov blanket by selecting a symptom in the menu on the left.
You can move each node in the diagram by click and drag. To deselect it click on the white space of the diagram. To restart the diagram refresh the page.
A. In the list below you will find the application and comprarison of Grow-Shrink, Hill Climbing, Max-Min Hill Climbing BN algorithms on the complete dataset of cancer patients (n=1328):
- [Online Figure 6] All cancer patients (n=1328), Grow-Shrink, 0.85 threshold. Sachs et al., 2005
- [Online Figure 7] All cancer patients (n=1328), Grow-Shrink, optimal threshold according to Scurati & Nagarajan, 2013
- [Online Figure 8] All cancer patients (n=1328), Hill Climbing, 0.85 threshold. Sachs et al., 2005
- [Online Figure 9] All cancer patients (n=1328), Hill Climbing, optimal threshold according to Scurati & Nagarajan, 2013
- [Online Figure 10] All cancer patients (n=1328), Max-Min Hill Climbing, 0.85 threshold. Sachs et al., 2005
- [Online Figure 11] All cancer patients (n=1328), Max-Min Hill Climbing, optimal threshold according to Scurati & Nagarajan, 2013
- [Online Figure 12] Cancer symptoms’ network differences between the Grow-Shrink and Hill Climbing models, 0.85 threshold (Sachs et al., 2005), all cancer patients (n=1328)
- [Online Figure 13] Cancer symptoms’ network differences between the Grow-Shrink and Hill Climbing models, optimal threshold according to Scurati & Nagarajan, 2013, all cancer patients (n=1328)
- [Online Figure 14] Cancer symptoms’ network differences between the Grow-Shrink and Max-Min Hill Climbing models, 0.85 threshold (Sachs et al., 2005), all cancer patients (n=1328)
- [Online Figure 15] Cancer symptoms’ network differences between the Grow-Shrink and Max-Min Hill Climbing models, optimal threshold according to Scurati & Nagarajan, 2013, all cancer patients (n=1328)
- [Online Figure 16] Cancer symptoms’ network differences between the Hill Climbing and Max-Min Hill Climbing models, 0.85 threshold (Sachs et al., 2005), all cancer patients (n=1328)
- [Online Figure 17] Cancer symptoms’ network differences between the Hill Climbing and Max-Min Hill Climbing models, optimal threshold according to Scurati & Nagarajan, 2013, all cancer patients (n=1328)
B. In the list below you will find, as a case study, the application of BNs on 4 different subgroups of cancer patients based on their gender and age (i.e., male vs female, < 65 versus > 65 years of age).
- [Online Figure 18] Male cancer patients (n=295), Max-Min Hill Climbing, 0.85 threshold. Sachs et al., 2005
- [Online Figure 19] Male cancer patients (n=295), Max-Min Hill Climbing, optimal threshold according to Scurati & Nagarajan, 2013
- [Online Figure 20] Female cancer patients (n=1033), Max-Min Hill Climbing, 0.85 threshold. Sachs et al., 2005
- [Online Figure 21] Female cancer patients (n=1033), Max-Min Hill Climbing, optimal threshold according to Scurati & Nagarajan, 2013
- [Online Figure 22] Female cancer patients (n=295, bootstrapped sampling), Max-Min Hill Climbing, 0.85 threshold. Sachs et al., 2005
- [Online Figure 23] Female cancer patients (n=295, bootstrapped sampling), Max-Min Hill Climbing, optimal threshold according to Scurati & Nagarajan, 2013
- [Online Figure 24] Cancer symptoms’ network differences between male (n=295) and female (n=1033) cancer patients, Max-Min Hill Climbing, 0.85 threshold. Sachs et al., 2005
- [Online Figure 25] Cancer symptoms’ network differences between male (n=295) and female (n=1033) cancer patients, Max-Min Hill Climbing, optimal threshold according to Scurati & Nagarajan, 2013
- [Online Figure 26] Cancer symptoms’ network differences between male (n=295) and female (n=295, bootstrapped sampling) cancer patients, Max-Min Hill Climbing, 0.85 threshold. Sachs et al., 2005
- [Online Figure 27] Cancer symptoms’ network differences between male (n=295) and female (n=295, bootstrapped sampling) cancer patients, Max-Min Hill Climbing, optimal threshold according to Scurati & Nagarajan, 2013
- [Online Figure 28] Cancer symptoms’ network differences between female (n=1033) and female (n=295, bootstrapped sampling) cancer patients, Max-Min Hill Climbing, 0.85 threshold. Sachs et al., 2005
- [Online Figure 29] Cancer symptoms’ network differences between male (n=1033) and female (n=295, bootstrapped sampling) cancer patients, Max-Min Hill Climbing, optimal threshold according to Scurati & Nagarajan, 2013
- [Online Figure 30] Cancer patients with age below 65 (n=958), Max-Min Hill Climbing, 0.85 threshold. Sachs et al., 2005
- [Online Figure 31] Cancer patients with age below 65 (n=958), Max-Min Hill Climbing, optimal threshold according to Scurati & Nagarajan, 2013
- [Online Figure 32] Cancer patients with age below 65 (n=370, bootstrapped sampling), Max-Min Hill Climbing, 0.85 threshold. Sachs et al., 2005
- [Online Figure 33] Cancer patients with age below 65 (n=370, bootstrapped sampling), Max-Min Hill Climbing, optimal threshold according to Scurati & Nagarajan, 2013
- [Online Figure 34] Cancer patients with age above 65 (n=370), Max-Min Hill Climbing, 0.85 threshold. Sachs et al., 2005
- [Online Figure 35] Cancer patients with age above 65 (n=370), Max-Min Hill Climbing, optimal threshold according to Scurati & Nagarajan, 2013
- [Online Figure 36] Cancer symptoms’ network differences between cancer patients below the age of 65 (n=958) and above the age of 65 (n=370), Max-Min Hill Climbing, 0.85 threshold. Sachs et al., 2005
- [Online Figure 37] Cancer symptoms’ network differences between cancer patients below the age of 65 (n=958) and above the age of 65 (n=370), Max-Min Hill Climbing, optimal threshold according to Scurati & Nagarajan, 2013
- [Online Figure 38] Cancer symptoms’ network differences between cancer patients below the age of 65 (n=370, bootstrapped sampling) and above the age of 65 (n=370), Max-Min Hill Climbing, 0.85 threshold. Sachs et al., 2005
- [Online Figure 39] Cancer symptoms’ network differences between cancer patients below the age of 65 (n=370, bootstrapped sampling) and above the age of 65 (n=370), Max-Min Hill Climbing, optimal threshold according to Scurati & Nagarajan, 2013
- [Online Figure 40] Cancer symptoms’ network differences between cancer patients below the age of 65 (n=958) and below the age of 65 (n=370, bootstrapped sampling), Max-Min Hill Climbing, 0.85 threshold. Sachs et al., 2005
- [Online Figure 41] Cancer symptoms’ network differences between cancer patients below the age of 65 (n=958) and above the age of 65 (n=370, bootstrapped sampling), Max-Min Hill Climbing, optimal threshold according to Scurati & Nagarajan, 2013